How to Determine Your Most Important Metrics
How to Determine Your Most Important Metrics
CMOs and Marketing agencies love to consider themselves “data-driven.” They want you to know that they LOVE digging into the most important metrics and finding the answers. It’s a selling point in an industry that was once built on the BS philosophy “they say 50% of marketing works, you just can’t tell which 50% it is.”
Marketers know everyone thinks they’re full of it and overcompensate in doing so. We went from saying “forget the numbers, it’ll all work out” to inventing a bunch of numbers that can be manipulated into making our work appear more valuable than it is. Take the “Lifetime Value of a Customer” as an example. Marketers love using this metric because it adds multiple years of revenue onto the ROI numbers.
“Assuming you keep this customer for 5 years, and they pay you $100,000 a year, then my work is worth at least $500,000, but I’ll go ahead and just charge you 20% of that.”
Lies, damn lies, and Mark Twain, right?
Numbers are very easy to misrepresent. At the end of the day, you want to grow your business, and you need to track data to measure your performance. So how do you simplify this process, so it’s not an overwhelming report of numbers?
You determine, track, and react to the Most Important Metrics.
What are your Most Important Metrics?
What are the Most Important Metrics to your company’s growth? You tell me. You know your business better than I do, so if I asked you to narrow down the 5-15 most important numbers you should be tracking, what would you say?
Would you go straight to Gross Revenue? Profit? Retention? Customer value?
You might not even know where to start. If that’s the case, take a look at a few popular figures that companies track in relation to their growth:
- New Customers
- Annual Value of a Customer
- Cost-Per-Acquisition
- Gross Revenue
- Net Revenue
- Profit Margin
- Conversion Rate
- Leads Generated
- Customer Retention Rate
- Website Traffic
- Cost-Per-Conversion
Using these as a starting point, try to add 1-5 more data points specific to you. For instance, if you are building an online database that requires new signups, you would add “Users” to the list. Or if you work with raw materials or fresh food, one of your most essential metrics may rely on not letting your product go to waste, and you would add “Product Use Percentage” or something even more granular to your list.
The List Through the Lens of a Company
A Financial Planning firm, we’ll call them SUCCESSion, specializes in estate planning. Most of their business comes from referrals from their partner network of lawyers, real estate agents, and other entrepreneurs. After reviewing their customer list, they recognize their highest-paying customers all come from the Acquisition Channel “referrals,” and that the gap is so wide that focusing on trying to “attract” the end-user through direct marketing and cold calls is a waste of money.
So they look at the base list and then add three Most Important Metrics to them underneath:
- New Customers
- Annual Value of a Customer
- Cost-Per-Acquisition
- Gross Revenue
- Net Revenue
- Profit Margin
- Conversion Rate
- Leads Generated
- Customer Retention Rate
- Website Traffic
- Cost-Per-Conversion
- Referrals
- Referral Sources
- Membership Networks
They go ahead and “kill” the metrics that aren’t as important to them and are left with the following list:
- New Customers
- Cost-Per-Acquisition
- Gross Revenue
- Profit Margin
- Conversion Rate
- Leads Generated
- Website Traffic
- Referrals
- Referral Sources
With their most important metrics set, they are now ready to measure the data that matters.
Organizing the Most Important Metrics into a Scorecard
Of all the powerful tools developed by Gino Wickman and EOS Worldwide, the scorecard is probably the biggest game-changer. From his book, Traction, Wickman explains:
According to an old business maxim, anything that is measured and watched is improved. The concept of managing through a Scorecard has been around for a long time. The idea has been expressed through many different terms. It’s been called a dashboard, flash report, scoreboard metrics, measurables, KPIs, smart numbers, and so on. Whatever you call it, it’s a handful of numbers that can tell you at a glance how your business is doing.
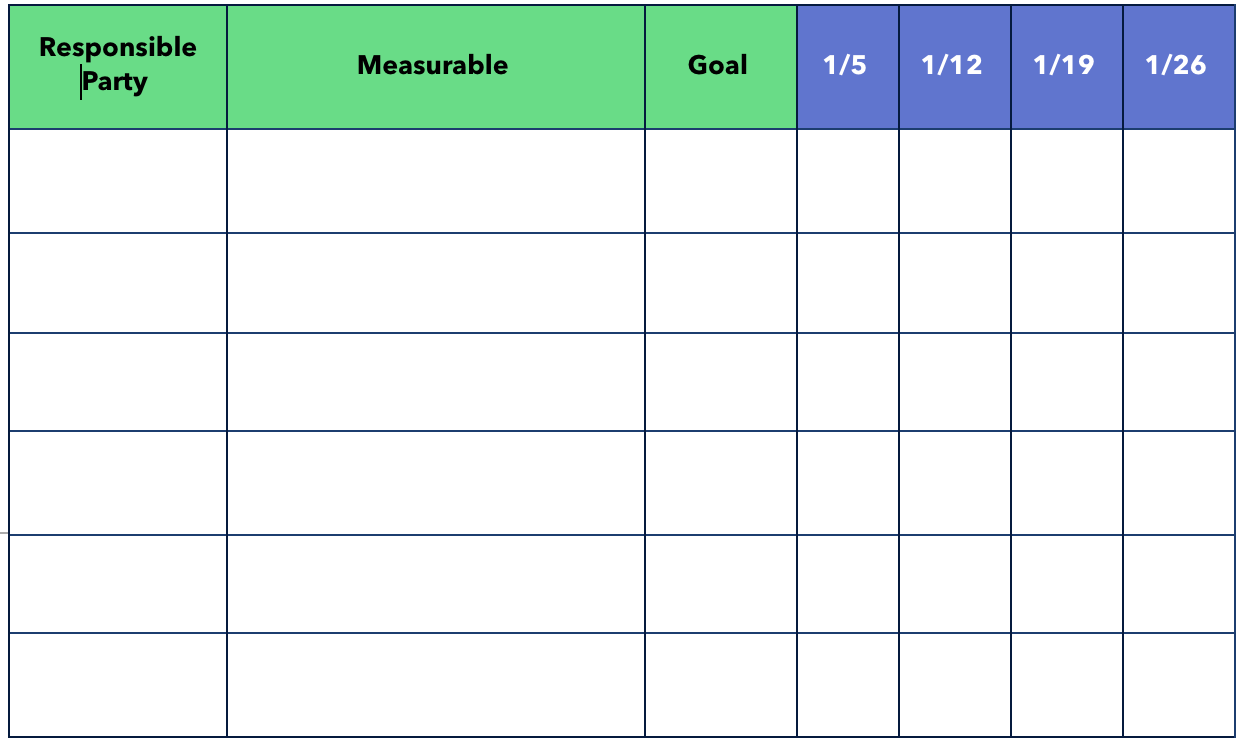
He goes on to show a diagram that looks like this:

The Scorecard has three columns: who’s responsible, the metric you’re tracking (in this case, it will be your MIMs), and the weekly goal. To the right, you insert your actual performance metrics and measure them against the weekly goal. It’s a straightforward but effective process.
The truth is, data dictates behavior. You need to look at the data at least weekly and have that performance drive the work for the upcoming week. Instead of looking at data through the lens of the past where the results have already been decided, scorecards help you turn data into a living, breathing organism that blooms and grows in the direction you need it to.
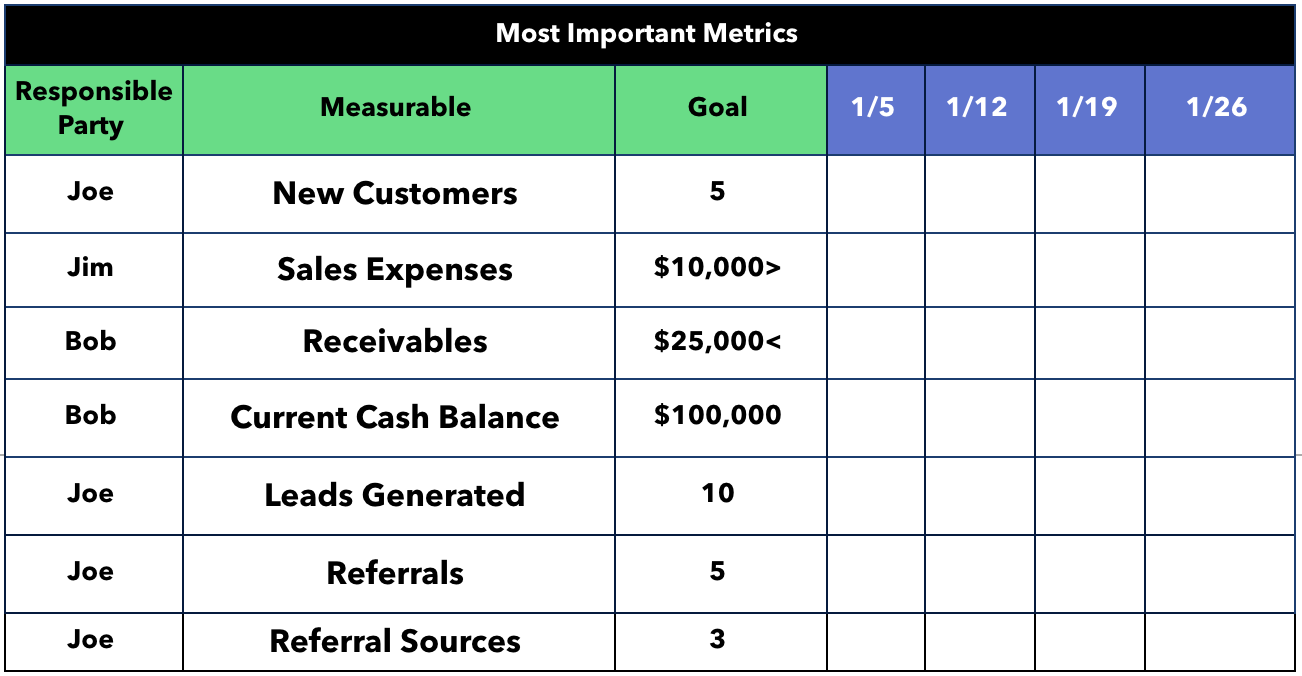
One thing to note, and this is unfortunate for our friends at SUCCESSion, a scorecard must have real numbers that can be reviewed weekly. For instance, it’s undoubtedly crucial for a company to track cost-per-acquisition, but due to a varying amount of factors, particularly the timing of a sales cycle, tracking a CPA weekly would be tough.
So SUCCESSion needs to get creative and turn these MIMs into a more tangible scorecard. Here’s what that would look like:

Using the Scorecard method of simplifying data, looking at it weekly, and reacting to it, companies can stay the course and hit their annual goals more accurately.
Conclusion
What about you? What are the Most Important Metrics to your company’s growth? Go through the exercise and figure out the 5-15 indicators you should track and measure, and fill out a Scorecard of your own!


